Long-distance travel places different demands on an electric bus than stop-and-go urban service. At highway speeds, air resistance becomes a major factor in energy consumption, and even small changes in body shape can influence how efficiently a vehicle moves.
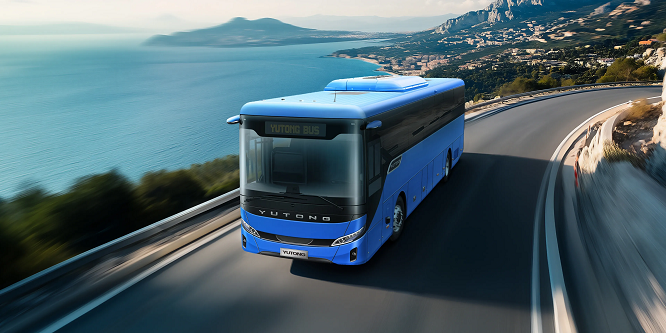
Understanding the relationship between airflow, vehicle design, and driving speed helps fleet operators evaluate the real-world benefits of a long distance electric bus. Aerodynamic performance is not simply a styling consideration; it affects energy use, range planning, cabin comfort, and operating costs across extended routes.
Why Aerodynamic Drag Increases at Highway Speeds
Air resistance rises sharply as vehicle speed increases. Under comparable atmospheric conditions, aerodynamic drag force is approximately proportional to the square of speed, while the power required to overcome that drag grows roughly with the cube of speed. As a result, a bus traveling at highway speed may need substantially more propulsion power than one moving at a moderate pace, even if the route and passenger load remain unchanged.
Vehicle frontal area and drag coefficient are two important variables in this relationship. A full-size bus has a relatively large frontal profile, so the amount of air displaced can be considerable. The drag coefficient describes how the vehicle’s shape influences resistance, while frontal area determines how much air it encounters. Reducing either factor can improve energy efficiency, although practical design changes must preserve passenger capacity, visibility, structural strength, and accessibility.
Wind conditions also complicate performance calculations. A headwind increases the vehicle’s relative speed through the air, potentially raising drag even when the speedometer reading remains constant. Crosswinds can disturb airflow around the sides and rear, creating additional aerodynamic forces that affect stability. For operators assessing a long distance electric bus, route exposure, seasonal weather, and typical cruising speeds are useful considerations alongside laboratory drag measurements.
Design Features That Influence Airflow
The front profile determines how air first encounters the vehicle. Rounded transitions, carefully shaped windscreen surrounds, and smoother connections between body panels can reduce abrupt pressure changes. A blunt front cannot always be avoided because of packaging and visibility requirements, but thoughtful detailing may help air move around the vehicle with less turbulence. The aim is to manage airflow rather than assume that a visually streamlined shape automatically delivers lower drag.
The roof and underbody also deserve attention. Roof-mounted equipment, exposed components, and sudden changes in body height can disturb airflow, while poorly managed underbody turbulence adds resistance around the wheels and chassis. Flush panel joints, suitable equipment placement, and carefully developed wheel-area geometry may improve the overall flow pattern. Each change needs to be evaluated within the vehicle’s engineering constraints, since cooling requirements, ground clearance, maintenance access, and component protection remain essential.
The rear section is another important area because air separates from the body and forms a turbulent wake. A large low-pressure region behind a bus contributes to pressure drag, which can be difficult to reduce on a vehicle with a box-shaped passenger compartment. Tapered transitions or carefully shaped rear corners may help control separation, provided they do not compromise usable interior space or vehicle dimensions. These details can contribute to a more efficient long distance electric bus, but their actual value depends on testing the complete vehicle rather than judging individual features in isolation.
Connecting Aerodynamic Performance With Electric Range
For battery-electric vehicles, lower aerodynamic drag can reduce the power needed to maintain a given cruising speed. The energy saved depends on the proportion of a route spent at higher speeds, along with elevation changes, traffic, passenger load, temperature, and auxiliary power demand. Aerodynamics generally matters more on open highways than during slow urban operation, where acceleration, braking, and frequent stops may account for a larger share of energy consumption.
Vehicle development teams can use computational fluid dynamics (CFD) to visualize pressure distribution, airflow separation, and turbulent wake formation before building physical prototypes. Wind-tunnel testing can then help validate simulations and compare design alternatives under controlled conditions. Road trials remain important because real journeys introduce crosswinds, changing speeds, road gradients, and operating conditions that simplified simulations may not fully capture.
Yutong Bus offers the IC12E (2026), with a standard battery configuration of 399.92 kWh and an optional 465.99 kWh configuration; its stated range can reach up to 675 km. These figures provide useful context when considering the relationship between battery capacity and route planning, although the achievable distance depends on operating conditions. Battery size alone does not determine efficiency, and a larger pack adds mass that the powertrain must move.
Measuring Results Under Real Operating Conditions
A credible aerodynamic assessment compares vehicles or configurations under consistent conditions. Test teams should record speed, ambient temperature, wind direction, passenger or ballast load, tyre pressure, and energy consumption over comparable routes. Without these controls, differences in traffic, weather, or driving behavior may be mistaken for improvements caused by body design. Repeated runs can help distinguish meaningful changes from ordinary variation.
Fleet managers can also review energy consumption by speed band. If a vehicle uses disproportionately more energy during sustained high-speed travel, aerodynamic drag may be one factor worth investigating. However, tyre rolling resistance, drivetrain efficiency, HVAC demand, battery temperature, and road gradient can also affect results. Combining vehicle telemetry with route information provides a more complete picture than relying on a single range estimate or a manufacturer’s headline figure.
Conclusion
High-speed efficiency depends on more than battery capacity or motor output. Body geometry, airflow separation, wind exposure, and operating speed all influence the energy required to cover a long route, while careful testing helps identify which design changes provide practical benefits. Aerodynamic gains should be judged alongside passenger needs, service conditions, and lifecycle costs rather than treated as isolated engineering achievements.
Through its electric coach development, Yutong Bus provides a real-world context for evaluating how battery configuration and vehicle design relate to range planning. For operators comparing a long distance electric bus, the most useful decision comes from verified performance data under conditions that closely match the intended service.